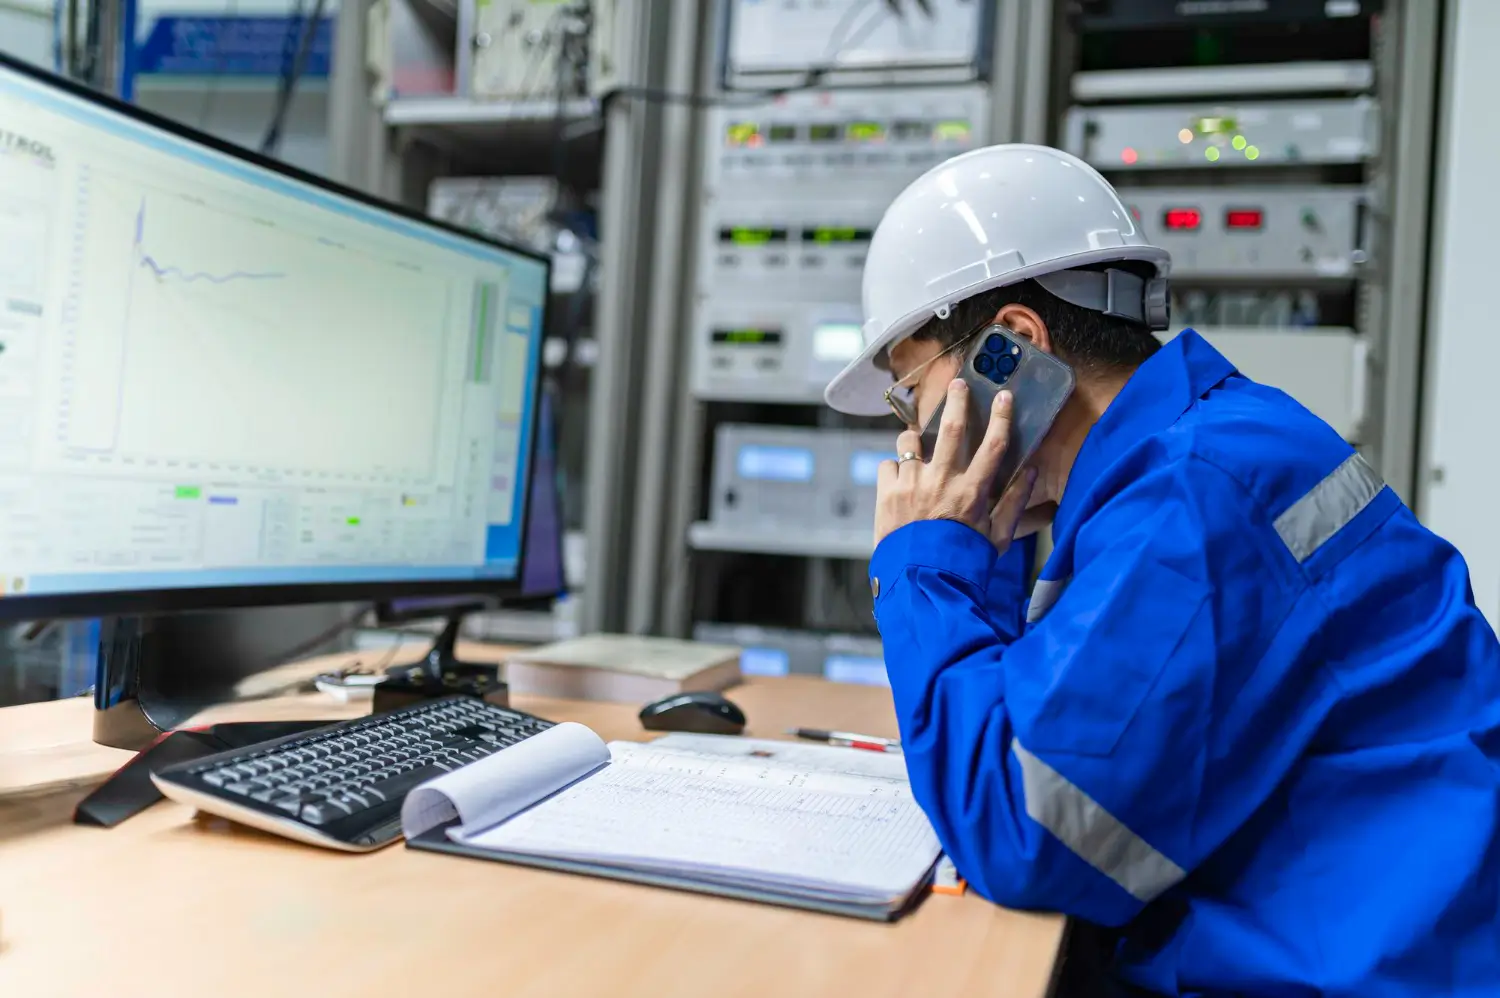

If you have ever left a production meeting unable to say for sure where the line lost time yesterday, the problem has a name: poor production visibility.
It happens when the operation cannot see, with reliable data and in a timely manner, what is actually happening on the factory floor: where the bottleneck is, how many micro-stoppages occurred, or why that batch turned into scrap.
The most common symptom is decision-making based on perception. Not for lack of competence, but for lack of evidence. And that is when this "invisible cost" shows up as lower productivity, delayed deliveries, and a more expensive operation.
Solving this rarely requires revolutionizing the factory. Most of the time, it requires fixing the existing database, and in this article, we will explain how to solve this problem.
In this article:
- How poor visibility shows up in daily factory life
- What it actually costs
- Why having a dashboard is not the same as having visibility
- Two real-world projects and what each one unlocked
- Where to start
How poor production visibility shows up in daily life
Almost no one uses the term "poor visibility." The problem actually arrives like this:
- "The line stops, but no one can say for how long." Two- or three-minute micro-stoppages don't make it into any logs. By the end of the shift, they have turned into hours. By the end of the month, they have turned into lost capacity that no one can identify.
- "The bottleneck moves every week." Without measurement by stage, the bottleneck is wherever someone complains the loudest. The wrong point gets fixed, and time continues to be lost exactly where it always was.
- "The loss is within the normal range." Normal compared to what? Without a reliable baseline, anything goes.
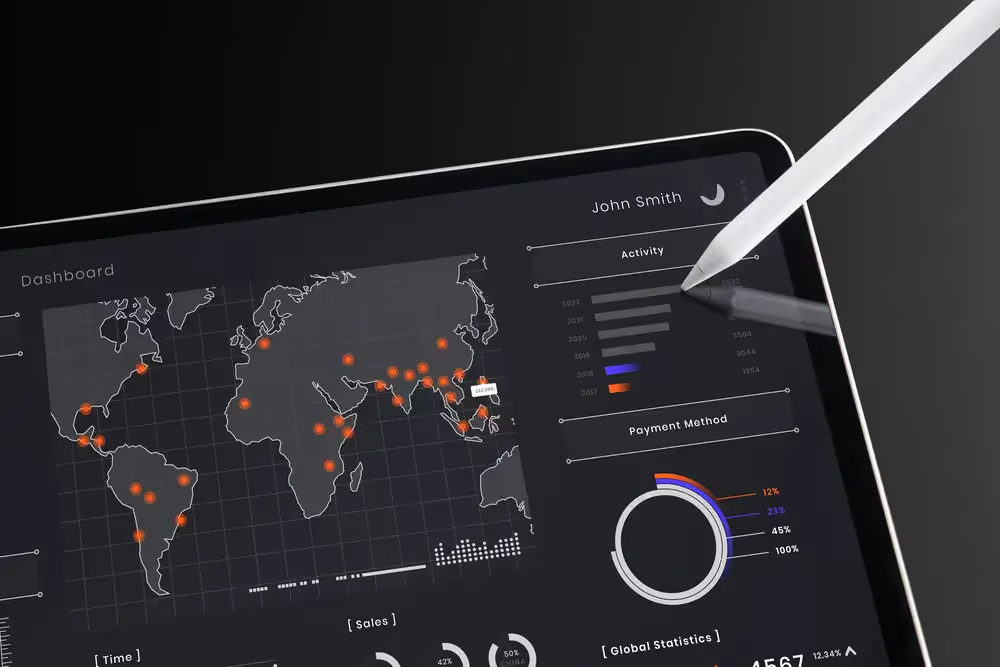
- "The dashboard exists, but no one trusts it." This is the most frustrating part. There was investment, there was a project, there’s a screen with a dashboard, yet managers keep making decisions based on gut feeling because the numbers are wrong on Tuesdays.
- "Every department brings a different number." When data comes from different sources without integration, meetings start with an argument over which spreadsheet is correct.
The common thread is the same: the experience of those on the front lines becomes the only source of truth. Experience is valuable, but it doesn't scale, it can't be audited, and it rarely identifies the root cause.
What poor visibility costs
It never appears as a line item in the budget. It appears diluted:
- Productivity: capacity lost to downtime that, because it isn't measured, never makes it into the improvement queue.
- Deadlines: rescheduling without knowing where the real bottleneck is just trial and error, and the customer feels it.
- Operating costs: scrapped material, overtime to make up for delays, and rework that could have been avoided earlier.
- Analytical effort: hours spent by qualified people manually consolidating spreadsheets, checking numbers, and redoing work the system should have delivered ready-made.
- Decision-making: the most expensive of all. When data is unstable, leadership makes decisions about investments, shifts, and capacity based on information they don't even trust themselves.
Having a dashboard is not the same as having visibility
This is the point that surprises those seeking help the most. Many operations have already invested in dashboards, are already collecting data, and have already hired BI tools, yet they continue to make decisions based on perception.
The reason is that visibility depends on three layers, and failing at any one of them cancels out the others:
- Collection: the data exists and is captured.
- Reliability: the data loads without failure, is traceable to its source, and someone is notified when it arrives inconsistent.
- Readability: the data is organized in a way that answers a business question.
Most projects that fail to take off have solved layer 1, skipped layer 2, and expected layer 3 to happen on its own. A dashboard fed by unstable data is not information: it is just another opinion, disguised as a chart.
Two projects, two layers of the same problem
1. When the problem is trust in the data, not a lack of it
In a project with Marelli, the scenario was exactly this.
The dashboard existed, gathered data from different operational fronts and was used by several managers for strategic decisions. What was missing was trust in it: instability in data loading, a lack of traceability to identify failures, an absence of alerts for inconsistent data, and difficulty in maintaining and operating the system.
The work focused on data architecture to ensure stability, reliability, and traceability in industrial dashboards: a robust data lake with data organized in a scalable, centralized, and reliable structure; data orchestration with Microsoft Fabric and full history; and automatic notifications flagging data inconsistencies.
The results were greater integration efficiency, automated processing, and ease of operation, with clean, up-to-date, and reliable data, recurring errors eliminated, and increased confidence in the analyses presented to the board.
The lesson for those with poor visibility: if your dashboard already exists but no one relies on it for decision-making, the problem is likely not the dashboard. It’s the data layer beneath it.
2. When information exists but is scattered
Another common scenario: the data is there, but it’s disorganized. This was the case in a project involving data science applied to animal nutrition, which involved complex and disorganized biological data, with available information being underutilized.
The path didn't start with the tool. It started with understanding the business, which means identifying project objectives and success metrics, while considering the client's challenges and priorities.
Next came the client immersion, with experts diving into the processes and the reality of the operation to contextualize the problems. Only then did the data understanding: mapping, consolidating, and analyzing what already existed, preparing the ground for development.
Finally, the custom solution , capable of integrating and analyzing information in an automated way, combining Data Analytics, Artificial Intelligence, interface design (UX/UI), and software development.
The result was a scenario where disorganized data turned into an automated process, with agility and precision in analysis: intelligent use of previously underutilized data, greater clarity for evolving products and processes, less effort and cost in complex analyses, and strategic decisions made with greater speed.
The lesson for those with poor visibility: defining the success metric before building anything is what prevents a project from becoming just another pretty dashboard that no one uses.
These are two different contexts—one involving architecture and reliability, the other organization and analysis—and neither is a continuation of the other. What they share is the method: understanding the problem and the metric before choosing the tool.
Where should you start?
If the description in this article sounds familiar, the first step isn't budgeting for technology. It’s choosing a decision that is currently based on perception—such as which line to prioritize, where to allocate maintenance, or which shift is losing the most time—and asking three questions:
- What data would make this decision objective?
- Is this data already being collected somewhere? In what state?
- If the data comes in wrong tomorrow, will anyone know?
The third question is the most relevant. Operations that don't have an answer for it usually discover that the right investment isn't in more data collection, but in the reliability of what is already being collected.
Solving this poor production visibility delivers three things in practice: more control over what happens in the operation, faster responses when something goes off-track, and evidence-based prioritization that targets the bottlenecks that actually matter.
This is the type of challenge that Venturus helps structure, from understanding the problem and success metrics to getting the solution running in production. If your operation is facing any of these situations, it’s worth having a conversation with our experts.